Google Analytics gives so much data that sometimes it becomes hard to digest. For larger sites, it is easy to become lazy and not want to look up the analytics for each page. Or maybe you have many editors for a site who don’t have access to your Google Analytics account and you want to provide them with data on how well their pages are performing.
With the Google Analytics API, we can easily display some basic analytics right on each page. Google offers many libraries for exporting your data or you can use a community-developed library like the GAPI PHP library created by Stig Manning which I’ll be using in this example.
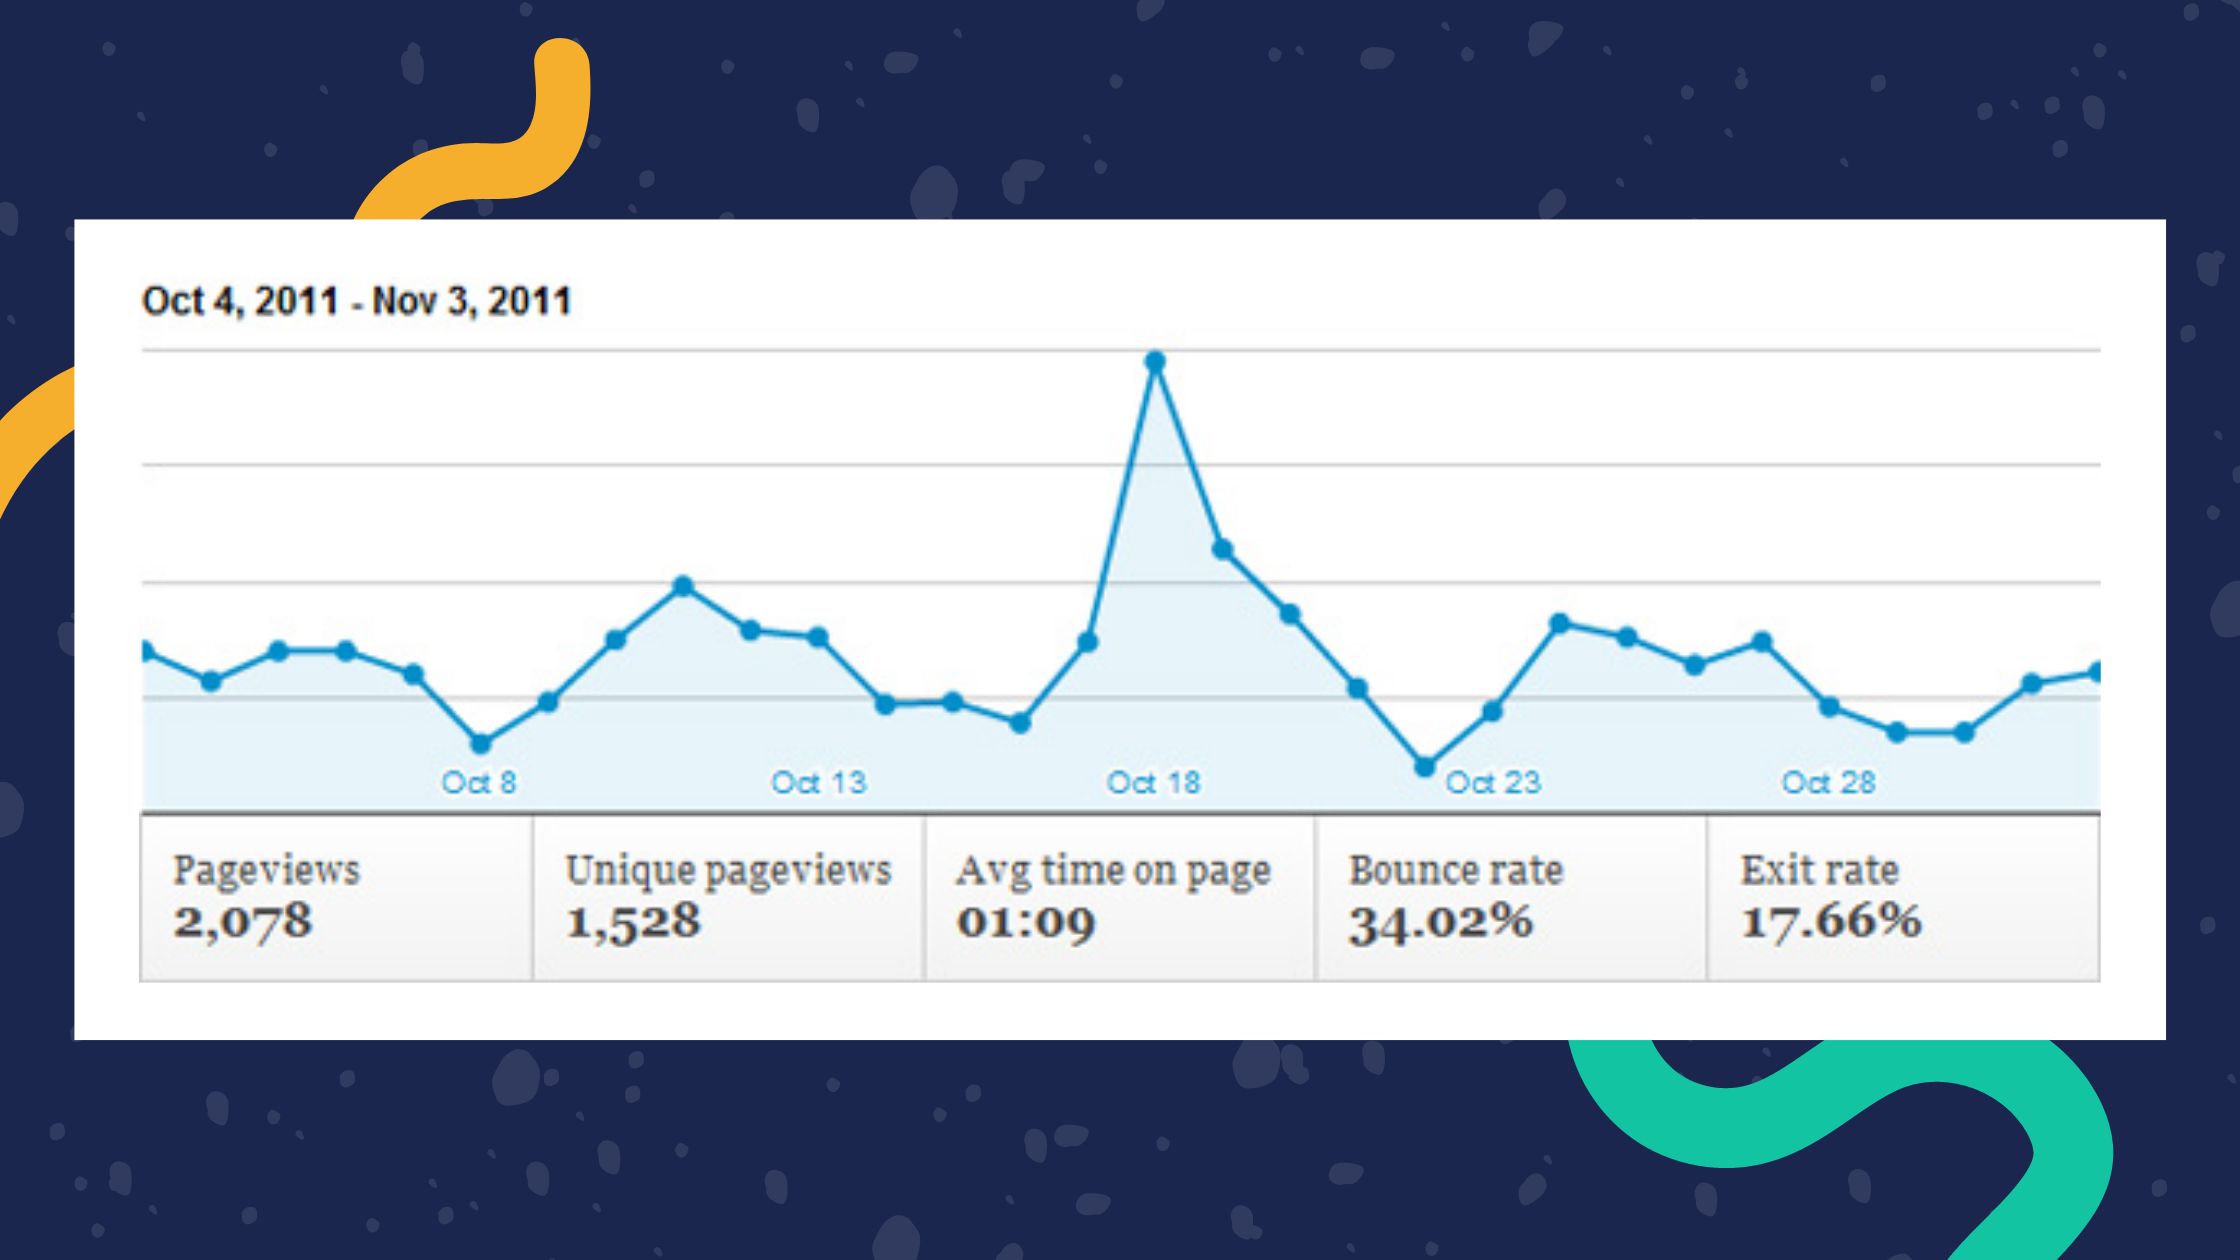
The final result will be a nice in-page graph and data that tell us some useful information about how well each page is performing:

Download the latest version of GAPI and extract it to a location in your site folder. Open your page template file and find where you want to place your analytics and then include the class you just extracted:
require('gapi.class.php');In order to connect to Google Analytics, we have to supply login information and the profile id of the specific account profile we want to connect to. While we’re defining variables let’s also define the page URL that we want to retrieve analytics.
$ga_email = 'youremail@gmail.com';
$ga_password = 'yourpassword';
$ga_profile_id = '12345678';
$ga_url = $_SERVER['REQUEST_URI'];
I’m not a fan of hardcoding login information into my code, but this method prevents other users from needing login access to your account to retrieve the data.
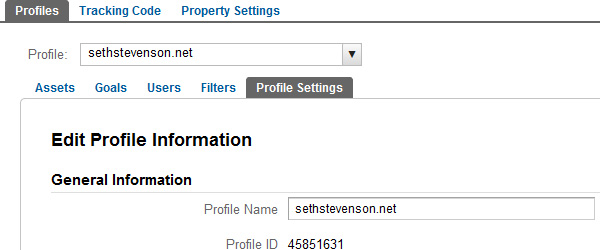
To find the profile id in Google Analytics, go to the settings page of your profile (gear icon in top right) then click on the Profile Settings tab and you will see the profile id.
Now let’s use the GAPI class to create a query and pull five metrics: page views, unique page views, exit rate, average time on page, and the bounce rate. All of these metrics will be based on the page we’re viewing. The GAPI documentation shows how to structure the query using the requestReportData() function:
requestReportData($report_id, $dimensions, $metrics, $sort_metric=null, $filter=null, $start_date=null, $end_date=null, $start_index=1, $max_results=30)So here’s our query which we’ll save the results to the $results variable:
$ga = new gapi($ga_email,$ga_password);
$ga->requestReportData($ga_profile_id, 'pagePath', array('pageviews', 'uniquePageviews', 'exitRate', 'avgTimeOnPage', 'entranceBounceRate'), null, 'pagePath == '.$ga_url);
$results = $ga->getResults();
If no start and end date are given GAPI will by default return the results for the last 30 days.
Before we display these results let’s create a function to convert seconds into minutes. This will be useful for displaying the average time on the page, which by default returns the result in seconds.
function secondMinute($seconds) {
  $minResult = floor($seconds/60);
  if($minResult < 10){$minResult = 0 . $minResult;}
  $secResult = ($seconds/60 - $minResult)*60;
  if($secResult < 10){$secResult = 0 . round($secResult);}
  else { $secResult = round($secResult); }
  return $minResult.":".$secResult;
}
Now it’s just a matter of parsing through the results and displaying them however you want.
echo '<div id="page-analtyics">';
foreach($results as $result) {
  echo '<div><span>Pageviews</span><br /><strong>'.number_format($result->getPageviews()).'</strong></div>';
  echo '<div><span>Unique pageviews</span><br /><strong>'.number_format($result->getUniquepageviews()).'</strong></div>';
  echo '<div><span>Avg time on page</span><br /><strong>'.secondMinute($result->getAvgtimeonpage()).'</strong></div>';
  echo '<div><span>Bounce rate</span><br /><strong>'.round($result->getEntrancebouncerate(), 2).'%</strong></div>';
  echo '<div><span>Exit rate</span><br /><strong>'.round($result->getExitrate(), 2).'%</strong></div>';
  echo '<div style="clear: left;"></div>';
}
echo '</div>';
GAPI gives easy to use functions for pulling metrics like:
getPageviews() and getAvgtimeonpage()
Add some CSS. Of course, you can make up your own and customize it to blend in with your site.
<style type="text/css">
#page-analtyics {
clear: left;
}
#page-analtyics .metric {
background: #fefefe; /* Old browsers */
background: -moz-linear-gradient(top, #fefefe 0%, #f2f3f2 100%); /* FF3.6+ */
background: -webkit-gradient(linear, left top, left bottom, color-stop(0%,#fefefe), color-stop(100%,#f2f3f2)); /* Chrome,Safari4+ */
background: -webkit-linear-gradient(top, #fefefe 0%,#f2f3f2 100%); /* Chrome10+,Safari5.1+ */
background: -o-linear-gradient(top, #fefefe 0%,#f2f3f2 100%); /* Opera 11.10+ */
background: -ms-linear-gradient(top, #fefefe 0%,#f2f3f2 100%); /* IE10+ */
background: linear-gradient(top, #fefefe 0%,#f2f3f2 100%); /* W3C */
filter: progid:DXImageTransform.Microsoft.gradient( startColorstr='#fefefe', endColorstr='#f2f3f2',GradientType=0 ); /* IE6-9 */
border: 1px solid #ccc;
float: left;
font-size: 12px;
margin: -4px 0 1em -1px;
padding: 10px;
width: 105px;
}
#page-analtyics .metric:hover {
background: #fff;
border-bottom-color: #b1b1b1;
}
#page-analtyics .metric .legend {
background-color: #058DC7;
border-radius: 5px;
-moz-border-radius: 5px;
-webkit-border-radius: 5px;
font-size: 0;
margin-right: 5px;
padding: 10px 5px 0;
}
#page-analtyics .metric strong {
font-size: 16px;
font-weight: bold;
}
#page-analtyics .range {
color: #686868;
font-size: 11px;
margin-bottom: 7px;
width: 100%;
}
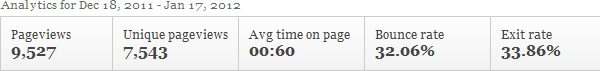
</style>Result so far:
In Google Analytics everyone is very familiar with the big blue charts that often show page views or visits. Using the Google Charts API in combination with the Google Analytics API we can add a visually similar chart to our in-page analytics that displays the number of page views over the last 30 days. I won’t break down the Charts API in a great amount of detail but if you want to learn more Google offers good documentation for it.
Continuing from the example above we can reuse the $ga and $ga_url variables to create a new GAPI request. However this time instead of retrieving the total results over a span of time we need to get individual results for each day so we can feed this data to the chart. The trick to this is to set up the query to use both a dimension and filter of ‘date’. This will return the number of page views for every day in the last 30 days.
$ga->requestReportData($ga_profile_id, array('date'),array('pageviews'), 'date', 'pagePath == '.$ga_url);
$results = $ga->getResults();
Next set up a spot in your page template that will contain the chart, this will initially be an empty div that will later be modified by the Google Charts API.
<div id="chart"></div>Include the Google Charts API
<script type="text/javascript" src="https://www.google.com/jsapi"></script>In this case, JavaScript will be used to create a new chart populated by the data we retrieved. Load the Google Charts API and tell it to use a function we will create called draw chart().
<script type="text/javascript">
google.load("visualization", "1", {packages:["corechart"]});
google.setOnLoadCallback(drawChart);
Now time to create the function draw chart(). This function will start off by defining the columns of data that will be used in the chart. You can think of the columns as being each axis of a graph.
function drawChart() {
  var data = new google.visualization.DataTable();
  data.addColumn('string', 'Day');
  data.addColumn('number', 'Pageviews');
Once the data structure for the chart is set up it can accept the data pulled from GAPI. Google Charts uses the function addRows() that can accept comma-separated arrays of data. Each of these arrays will contain one day and the number of pageviews for that day.
data.addRows([
  <?php
  foreach($results as $result) {
    echo '["'.date('M j',strtotime($result->getDate())).'", '.$result->getPageviews().'],';
  }
  ?>
]);
Lastly, create a chart and pass it the data we just set up. You will see there are several variables in this section that can be adjusted to fit your templates such as width, height, and title. The specific chart in use is Google’s Area Chart in case you want to look up additional options.
var chart = new google.visualization.AreaChart(document.getElementById('chart'));
chart.draw(data, {width: 630, height: 180, title: '<?php echo date('M j, Y',strtotime('-30 day')).' - '.date('M j, Y'); ?>',
colors:['#058dc7','#e6f4fa'],
areaOpacity: 0.1,
hAxis: {textPosition: 'in', showTextEvery: 5, slantedText: false, textStyle: { color: '#058dc7', fontSize: 10 } },
pointSize: 5,
legend: 'none',
chartArea:{left:0,top:30,width:"100%",height:"100%"}
});
} // End of drawChart()
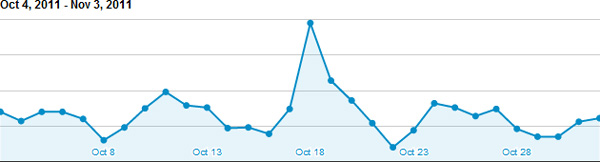
</script>That’s it! You should now have a working chart. You can even hover your mouse over each point and it will tell you the exact number of pageviews for that day.
<style type="text/css">
/* IN PAGE ANALYTICS */
#page-analtyics {
    clear: left;
}
#page-analtyics .metric {
    background: #fefefe; /* Old browsers */
        background: -moz-linear-gradient(top, #fefefe 0%, #f2f3f2 100%); /* FF3.6+ */
        background: -webkit-gradient(linear, left top, left bottom, color-stop(0%,#fefefe), color-stop(100%,#f2f3f2)); /* Chrome,Safari4+ */
        background: -webkit-linear-gradient(top, #fefefe 0%,#f2f3f2 100%); /* Chrome10+,Safari5.1+ */
        background: -o-linear-gradient(top, #fefefe 0%,#f2f3f2 100%); /* Opera 11.10+ */
        background: -ms-linear-gradient(top, #fefefe 0%,#f2f3f2 100%); /* IE10+ */
        background: linear-gradient(top, #fefefe 0%,#f2f3f2 100%); /* W3C */
        filter: progid:DXImageTransform.Microsoft.gradient( startColorstr='#fefefe', endColorstr='#f2f3f2',GradientType=0 ); /* IE6-9 */
    border: 1px solid #ccc;
    float: left;
    font-size: 12px;
    margin: -4px 0 1em -1px;
    padding: 10px;
    width: 105px;
}
#page-analtyics .metric:hover {
    background: #fff;
    border-bottom-color: #b1b1b1;
}
#page-analtyics .metric .legend {
    background-color: #058DC7;
    border-radius: 5px;
        -moz-border-radius: 5px;
        -webkit-border-radius: 5px;
    font-size: 0;
    margin-right: 5px;
    padding: 10px 5px 0;
}
#page-analtyics .metric strong {
    font-size: 16px;
    font-weight: bold;
}
#page-analtyics .range {
    color: #686868;
    font-size: 11px;
    margin-bottom: 7px;
    width: 100%;
}
</style>
<?php
require('gapi.class.php');

/* Define variables */
$ga_email       = 'youremail@gmail.com';
$ga_password    = 'yourpassword';
$ga_profile_id  = '12345678';
$ga_url         = $_SERVER['REQUEST_URI'];

/* Create a new Google Analytics request and pull the results */
$ga = new gapi($ga_email,$ga_password);
$ga->requestReportData($ga_profile_id, array('date'),array('pageviews'), 'date', 'pagePath == '.$ga_url);

$results = $ga->getResults();
?>

<!-- Create an empty div that will be filled using the Google Charts API and the data pulled from Google -->
<div id="chart"></div>

<!-- Include the Google Charts API -->
<script type="text/javascript" src="https://www.google.com/jsapi"></script>

<!-- Create a new chart and plot the pageviews for each day -->
<script type="text/javascript">
  google.load("visualization", "1", {packages:["corechart"]});
  google.setOnLoadCallback(drawChart);
  function drawChart() {
    var data = new google.visualization.DataTable();

    <!-- Create the data table -->
    data.addColumn('string', 'Day');
    data.addColumn('number', 'Pageviews');

    <!-- Fill the chart with the data pulled from Analtyics. Each row matches the order setup by the columns: day then pageviews -->
    data.addRows([
      <?php
      foreach($results as $result) {
          echo '["'.date('M j',strtotime($result->getDate())).'", '.$result->getPageviews().'],';
      }
      ?>
    ]);

    var chart = new google.visualization.AreaChart(document.getElementById('chart'));
    chart.draw(data, {width: 630, height: 180, title: '<?php echo date('M j, Y',strtotime('-30 day')).' - '.date('M j, Y'); ?>',
                      colors:['#058dc7','#e6f4fa'],
                      areaOpacity: 0.1,
                      hAxis: {textPosition: 'in', showTextEvery: 5, slantedText: false, textStyle: { color: '#058dc7', fontSize: 10 } },
                      pointSize: 5,
                      legend: 'none',
                      chartArea:{left:0,top:30,width:"100%",height:"100%"}
    });
  }
</script>

<?php
$ga->requestReportData($ga_profile_id, 'pagePath', array('pageviews', 'uniquePageviews', 'exitRate', 'avgTimeOnPage', 'entranceBounceRate'), null, 'pagePath == '.$ga_url);
$results = $ga->getResults();

function secondMinute($seconds) {
    $minResult = floor($seconds/60);
    if($minResult < 10){$minResult = 0 . $minResult;}
    $secResult = ($seconds/60 - $minResult)*60;
    if($secResult < 10){$secResult = 0 . round($secResult);}
    else { $secResult = round($secResult); }
    return $minResult.":".$secResult;
}
echo '<div id="page-analtyics">';
foreach($results as $result) {
    echo '<div class="metric"><span class="label">Pageviews</span><br /><strong>'.number_format($result->getPageviews()).'</strong></div>';
    echo '<div class="metric"><span class="label">Unique pageviews</span><br /><strong>'.number_format($result->getUniquepageviews()).'</strong></div>';
    echo '<div class="metric"><span class="label">Avg time on page</span><br /><strong>'.secondMinute($result->getAvgtimeonpage()).'</strong></div>';
    echo '<div class="metric"><span class="label">Bounce rate</span><br /><strong>'.round($result->getEntrancebouncerate(), 2).'%</strong></div>';
    echo '<div class="metric"><span class="label">Exit rate</span><br /><strong>'.round($result->getExitrate(), 2).'%</strong></div>';
    echo '<div style="clear: left;"></div>';
}
echo '</div>';
?>


